How to Present Research Findings Clearly With Tables, Figures, and Charts
Strong research findings can lose impact when they are presented poorly. Clear tables, effective figures, and well-designed charts help researchers communicate evidence more accurately, more efficiently, and more persuasively.
Research communication depends not only on the quality of the analysis, but also on the clarity with which the results are presented. Even strong findings can become difficult to understand when tables are overloaded, figures are poorly labeled, or charts are selected without regard to the message they are supposed to communicate. In contrast, well-designed visuals can make evidence easier to interpret, more transparent, and more memorable.
Tables, figures, and charts are not decorative additions to research writing. They are analytical communication tools. Their purpose is to help readers grasp patterns, comparisons, relationships, magnitudes, and evidence structures that might otherwise remain hidden or difficult to follow in continuous text.
This article explains how to present research findings clearly using tables, figures, and charts, and how researchers can make visual communication a genuine strength of their academic work.
1. Start With the Message, Not the Graphic
One of the most common mistakes in research communication is beginning with a chart type rather than with the analytical message. Researchers sometimes create visuals because they feel expected to include them, not because the visual has a clear communicative purpose.
Before choosing a table, figure, or chart, it is useful to ask:
- What exactly should the reader understand from this result?
- Is the goal to compare categories, show change over time, reveal distribution, or highlight relationships?
- Would the finding be clearer in text, in a table, or in a visual figure?
The best visual communication begins with a precise message. Once that message is clear, the form becomes easier to choose appropriately.
A strong visual is not the one that looks most impressive. It is the one that helps the reader understand the most important result with the least confusion.
2. Use Tables When Precision Matters
Tables are usually the best choice when readers need exact values, detailed comparisons, or multiple variables presented in a structured way. They are especially useful for regression output, summary statistics, category-level comparisons, and descriptive breakdowns where precision is essential.
A strong table should:
- have a clear and informative title
- use readable labels for rows and columns
- avoid unnecessary decimal precision
- present values in a consistent format
- highlight structure without visual clutter
A table should make reading easier, not harder. When too much information is packed into one place, even accurate data become difficult to interpret.
3. Use Charts When Patterns Matter More Than Exact Numbers
Charts are often better than tables when the goal is to communicate general patterns, comparisons, trends, or relationships at a glance. They allow readers to see the structure of the findings quickly without reading through large amounts of numerical detail.
Charts are particularly useful when the researcher wants to show:
- differences across groups
- changes over time
- distribution of values
- associations between variables
- relative magnitude or composition
The key principle is that a chart should simplify interpretation, not create a visual version of complexity that is harder to understand than the original data.
4. Match the Chart Type to the Analytical Purpose
Different chart types serve different purposes. Using the wrong one can weaken the communication of otherwise strong results. For example, a line chart is often effective for trends over time, while a bar chart may be better for comparing categories. Scatter plots are useful for showing relationships, while histograms are more appropriate for distributions.
Researchers should choose chart types based on what the reader needs to see most clearly, rather than on habit or visual appeal alone.
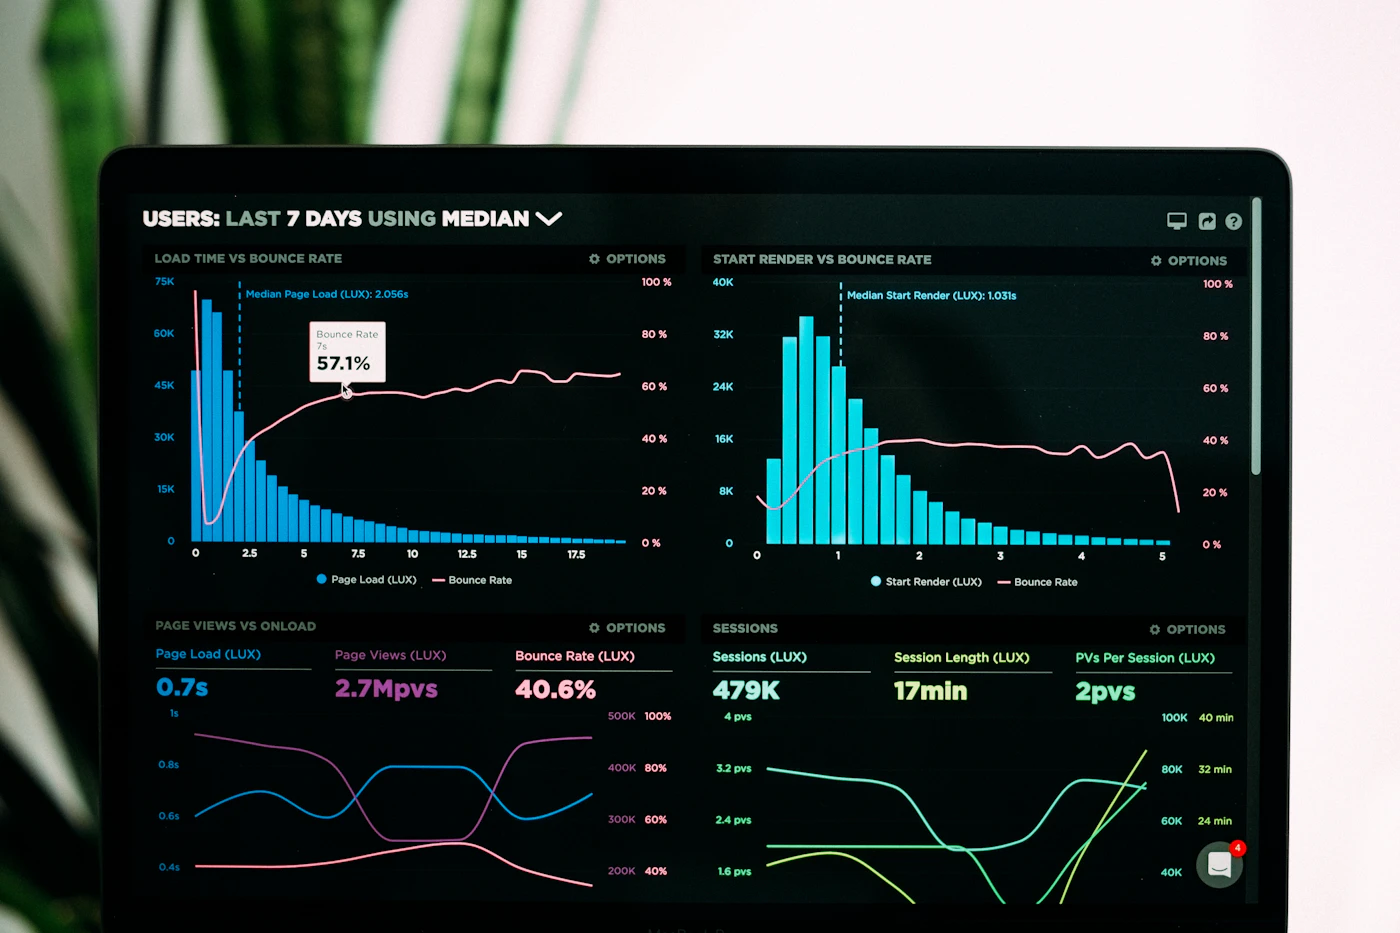
| Visual Type | Best Used For |
|---|---|
| Table | Exact values, detailed comparisons, statistical outputs |
| Bar chart | Comparing categories or group differences |
| Line chart | Showing trends or changes over time |
| Scatter plot | Exploring relationships between two variables |
| Histogram | Displaying distributions of numerical values |
| Box plot | Comparing distributions and identifying spread or outliers |
5. Keep Visuals Simple and Focused
Clarity in research visualization often comes from restraint. Overloaded graphics with too many categories, colors, labels, or decorative features can distract from the actual result. Simplicity helps the reader identify what matters quickly.
Good practice usually involves:
- limiting each visual to one main message
- avoiding unnecessary gridlines, shading, or effects
- removing redundant labels and decorative elements
- using spacing and alignment to improve readability
- keeping legends and annotations concise
A visual does not need to contain all available information. It needs to contain the information that helps the reader understand the result most effectively.
6. Titles, Labels, and Notes Should Guide Interpretation
A table or figure should never force readers to guess what it represents. Clear titles, labels, captions, and notes are essential. These elements provide the context needed to interpret the content accurately.
Strong titles and labels usually indicate:
- what variables or categories are being shown
- what unit of measurement is used
- what time period or population is covered
- what the reader should notice if interpretation is not obvious
Notes are especially useful when abbreviations, data transformations, significance markers, or special methodological decisions need explanation.
A reader should be able to understand the basic meaning of a table or figure without having to search through the surrounding text to decode it.
7. Avoid Misleading Visual Design
Visuals can be persuasive, but that also means they can mislead if designed carelessly. Ethical and accurate research communication requires that charts and figures represent data honestly. Distorted scales, inappropriate truncation of axes, exaggerated contrasts, or visually dramatic but analytically weak graphics can create false impressions.
Researchers should be cautious about:
- truncating axes in ways that exaggerate small differences
- using 3D effects that distort perception
- overusing color intensity to imply stronger effects than exist
- showing too many categories in one graphic
- using visually striking designs that reduce interpretability
Good visualization is not only about attractiveness. It is also about accuracy and integrity in presentation.
8. Integrate Visuals With the Written Argument
Tables and figures should not sit in the text as isolated objects. They should be integrated into the argument. The surrounding discussion should prepare the reader for what is shown, explain why it matters, and clarify how the visual relates to the broader interpretation.
This means that researchers should:
- refer to each table or figure directly in the text
- explain the main pattern or takeaway
- avoid simply repeating every number already visible
- use the visual to support analytical reasoning rather than replace it
A strong visual becomes much more valuable when it functions as part of the research narrative rather than as an appendix-like insertion.
9. Adapt Visual Communication to the Audience
The best way to present findings depends partly on who will read or view them. A journal article, conference presentation, policy brief, dissertation chapter, and public-facing report may all require different levels of detail and different forms of visual emphasis.
For example:
- academic papers may require precise tables and full model outputs
- conference slides may need simplified visuals with immediate impact
- policy briefs may benefit from clear summary charts and concise captions
- public communication may require accessible language and less technical presentation
Good research communication always considers not only what is being shown, but also who needs to understand it.
10. Why Clear Visual Presentation Improves Research Quality
Clear presentation is not just a matter of style. It improves research quality itself. When tables and charts are designed carefully, they help the researcher think more clearly, identify weaknesses in the evidence, and communicate findings more rigorously.
Good visual presentation supports research by:
- making patterns easier to detect and explain
- improving transparency in reporting
- reducing reader confusion
- strengthening the persuasiveness of the argument
- increasing accessibility for different audiences
In this sense, data visualization is not separate from analysis. It is part of how analysis is understood and evaluated.
Conclusion
Presenting research findings clearly with tables, figures, and charts is a core skill in academic communication. Strong visuals do not merely display data. They help readers see structure, understand comparisons, and interpret findings with greater confidence. To achieve this, researchers need to choose the right format, simplify where possible, label clearly, avoid misleading design, and connect visuals directly to the written argument.
In many cases, the difference between confusing results and compelling evidence lies not in the analysis itself, but in how that analysis is presented. Clear visual communication makes research more understandable, more credible, and more impactful.
The most effective tables and figures are those that respect the reader’s attention while making the core message of the research immediately visible.
Need help presenting your findings more clearly and professionally?
AcademyIQ connects researchers with verified experts in data visualization, statistical reporting, academic writing, and research communication. If you want your tables, charts, and figures to communicate results more effectively, expert support can help strengthen every stage of presentation.